Tolerance stacking (or tolerance stack-up) is the cumulative effect of individual part tolerances and dimensional variations within an assembly. It calculates how small manufacturing errors combine to cause interference, misalignment, or excessive clearance in the final product.
While the definition is straightforward, the reality on the factory floor is often a costly surprise. Every single part can pass individual quality inspection, yet the final assembly can still bind or fail to fit together. This happens because minor variations from machining, bending, finishing, and hardware installation physically compound at one critical mating feature.
This guide breaks down how to build an accurate dimension chain for this exact scenario, choose between Worst-Case and RSS statistical analysis, and apply Design for Manufacturability (DFM) strategies to fix stack-up issues before they reach production.
Quick Answer: Tolerance Analysis Methods
- Worst-Case is used for critical structures that require guaranteed geometric interchangeability.
- Root Sum Squares (RSS) works well for volume production where the process is stable and supported by reliable data.
- 2D or 3D Analysis is required for angular errors, part rotation, and non-linear variation.
- Design Optimization must focus on reducing primary error sources before tightening individual part tolerances.
Define the Assembly Requirement and Build the Stack
Before calculating any values, the final assembly function must be translated into a measurable dimension chain.
Functional Result and Failure Limits
The first step is defining the specific dimension or position that requires control. Engineers distinguish between Mechanical Fit (e.g., physical assembly limits) and Mechanical Performance (e.g., motion range). For the enclosure scenario, the focus is strictly Mechanical Fit.
Set the target nominal value, upper limit, and lower limit. The specific requirements to evaluate include:
- The target position of the PCB connector relative to the panel opening.
- The maximum allowable horizontal (X) and vertical (Y) offset.
- The minimum required edge clearance to prevent the connector from scraping the panel.
- Whether physical contact or slight interference is acceptable.
If the offset exceeds these limits, the connector will not fit through the panel, resulting in assembly failure.
Dimension Chain, Datums, and Direction
A dimension chain maps the physical path from a starting point to the final functional result. Identify every part dimension and process step that influences the final gap.
Each dimension in the chain either adds to the final gap (positive direction) or reduces it (negative direction). Select functional datums that match the actual assembly sequence and fixture positioning on the shop floor. Exclude reference dimensions or duplicate dimensions that do not directly affect the specific gap being analyzed.
Table 1: Contributor Chain for Connector Alignment
| Contributor | Nominal | Direction | Tolerance | Datum | Process |
|---|---|---|---|---|---|
| Panel opening | — | Positive | — | Datum A | Laser cutting |
| Bend location | — | Negative | — | Datum A | CNC bending |
| Bracket holes | — | Positive | — | Datum B | CNC machining |
| PEM location | — | Negative | — | Datum A | Hardware insertion |
| PCB mounting | — | Positive | — | Datum C | Assembly |
Limits of One-Dimensional Analysis
A basic 1D dimension chain works well for parallel dimensions, axial clearances, linear position shifts, and simple hole-to-hole distance or thickness stacks.
However, a 1D addition method is insufficient when variations occur across multiple axes. A 1D stack cannot accurately account for angular errors, part rotation, simultaneous X and Y axis variation, perpendicularity, leverage effects, or flexible part deformation.
A single multi-dimensional error can easily break a 1D calculation. For example, a 0.5-degree perpendicularity error on an internal bracket might pass a basic caliper check, but it can shift the PCB connector by 2 mm at the panel, causing a hard interference. For these conditions, vector analysis, 2D/3D tolerance software, or Monte Carlo simulations are required.
Calculate Worst-Case and Statistical Variation
Once the dimension chain is established, use it to calculate the expected variation.
Nominal Result and Limit Conversion
The theoretical assembly result is calculated using a simple linear equation:
R = a₁X₁ + a₂X₂ + … + aₙXₙ
Where:
- R is the final assembly result.
- X_i represents the individual contributor dimensions.
- a_i indicates the direction or sensitivity (typically +1 or -1 in a 1D stack).
Before running the calculation, all tolerances must be standardized. Manufacturing drawings use a mix of bilateral symmetric, bilateral asymmetric, unilateral, and limit dimensions. For asymmetric tolerances, calculate the absolute maximum and minimums directly, or convert them into a new nominal midpoint with a symmetric tolerance range.
Worst-Case Stack
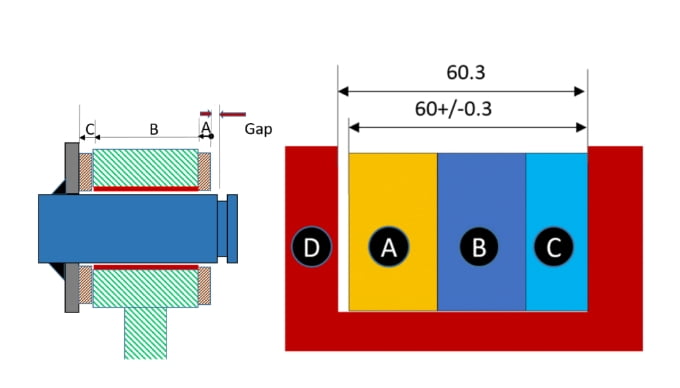
The Worst-Case tolerance calculates the absolute maximum variation by assuming every part is at its extreme acceptable limit simultaneously:
T_WC = ∑ |aᵢ|Tᵢ
Applying this to the enclosure calculates the maximum connector offset, minimum edge clearance, and the absolute risk of interference.
This method requires strict assumptions: all critical contributors are included, every part strictly meets the drawing limits, measurement datums match design datums, and parts do not deform during assembly.
Worst-Case results are extremely conservative. While it guarantees 100% interchangeability, it destroys budgets. Forcing a Worst-Case fit often means tightening tolerances from ±0.1 mm to ±0.02 mm. In CNC machining, this level of tightening typically increases part cost by 200% to 300% due to slower feed rates, frequent tool changes, and 100% CMM inspection requirements.
RSS Stack
Statistical analysis (Root Sum Squares) calculates the standard deviation of the final assembly based on the probability of variation:
σ_R = √[∑(aᵢσᵢ)²]
RSS is standard for volume production. It relies on the statistical reality that it is highly unlikely for all parts in an assembly to hit their extreme limits at the exact same time. However, RSS is only valid under specific conditions:
- Input data comes from a stable manufacturing process with a known capability (typically a Cpk ≥ 1.33, meaning the process variation is well within the tolerance limits).
- All dimensions use a uniform Sigma range.
- The process mean is centered near the target nominal.
- The contributing variables are independent of one another.
- The distribution type matches the analysis method.
Common risks that ruin RSS calculations include process mean shifts, correlation between dimensions (e.g., a single setup machining multiple holes), and inappropriately combining data from different suppliers. A frequent engineering error is blindly treating the drawing tolerance as a standard deviation, or relying on small prototype sample sizes that do not represent high-volume production reality.
Table 2: Method Selection Guide
| Project Condition | Recommended Method | Required Input | Main Limitation |
|---|---|---|---|
| Critical short stack | Worst-Case | Drawing limits | Conservative result; drives up cost |
| Stable volume production | RSS | Mean and standard deviation | Relies on strict statistical assumptions |
| Angular or spatial assembly | 2D or 3D analysis | Geometry and process data | Higher analysis effort |
| Complex nonlinear system | Monte Carlo | Defined probability distributions | Requires extensive data and computation |
Account for Variation From Real Manufacturing Processes
A common disconnect between engineering and procurement is assuming that drawing tolerances directly translate to the finished part. In reality, final dimensions are the result of physical manufacturing constraints.
Machining and Setup Changes
In CNC machining, error accumulates every time a part is moved. If an aluminum frame requires multiple setups, the transfer between fixtures introduces datum shift. Tool wear and thermal expansion during a long cycle further alter final dimensions.
A frequent issue occurs when the machining datum does not match the assembly datum. If the operator locates the part from an outside rough edge, but the PCB mounts to an internal pocket, any variation in the wall thickness directly shifts the PCB location.
Furthermore, individual hole compliance does not guarantee pattern compliance. A single threaded hole on a CNC frame might pass a pin gauge perfectly. However, if the entire hole pattern is shifted by 0.05 mm relative to the sheet metal cover, the fasteners will bind. Hole size and true position jointly dictate whether the parts will assemble.
Sheet Thickness and Bending
Sheet metal is a primary source of tolerance stack-ups. First, raw material thickness varies. A standard batch of 2.0 mm aluminum sheet can easily vary by ±0.08 mm.
When that sheet is formed, errors accumulate rapidly. Each bend introduces variations in location, angle deviation, and changes to the inside radius. Engineers must separate two distinct bending concepts:
- Bend Allowance (and K-factor) determines the theoretical flat pattern in CAD.
- Process Variation (material batch differences, springback, tooling wear) determines whether the physical bend repeatedly hits the target dimension. Do not attribute all physical bending errors to an incorrect K-factor.
Additionally, thin sheet metal parts inherently warp. A part that measures out of tolerance in a “free state” on a CMM may actually assemble perfectly once fastened. Engineering drawings should explicitly specify if the part can be inspected in a “restrained state” (clamped to a fixture), aligning inspection methods with actual assembly conditions and preventing disputes with suppliers.
Welding, Hardware, and Finishing
Assembly and secondary operations add the final layers of variation.
- Welding: Heat input causes distortion. The sequence of welds and the rigidity of the fixture dictate how much the metal pulls and warps.
- Hardware Insertion: PEM fasteners have a positional tolerance when pressed in. If the host hole is slightly oversized, the fastener can seat off-center or tilt, altering the functional position of the stud.
- Surface Finishing: Powder coating typically adds 50 to 80 microns of thickness per surface. Remember this is radial: a 50-micron coating reduces a hole’s total diameter by 100 microns. A nominal Ø4.0 mm clearance hole can quickly shrink to Ø3.84 mm, causing a standard M3 fastener to instantly bind during final assembly.
Reduce the Stack Before Tightening Part Tolerances
When a tolerance stack-up calculation reveals an assembly failure, the instinct is often to blanket-tighten all part tolerances (e.g., changing everything from ±0.1 mm to ±0.05 mm). This drives up machining costs, increases scrap, and frustrates suppliers. Instead, use design modifications to reduce the stack itself.
Dominant Contributors and Tolerance Allocation
Not all dimensions affect the final assembly equally. Calculate the percentage contribution of each dimension in your stack. Usually, one or two dimensions account for 70% of the total variation.
Focus on controlling those top contributors and loosen the tolerances on dimensions that have minimal impact. Allocate your tolerance budget based on actual process capability—CNC machining can hold tighter tolerances more cost-effectively than CNC bending. Do not force an even tolerance split across different manufacturing methods.
Functional Datums and GD&T
Proper Geometric Dimensioning and Tolerancing (GD&T) cuts the tolerance chain short. Always establish datums from the actual mating surfaces used in the final assembly. Never locate a critical hole pattern from an unstable bent edge or a welded seam.
For the enclosure case, use Position tolerance to control the hole patterns rather than basic X/Y linear dimensions. Applying a Maximum Material Condition (MMC) modifier is highly recommended for fastener clearance holes. MMC provides “bonus tolerance” on the hole’s position if the hole is machined slightly larger.
More importantly for cost control, MMC allows the use of physical Go/No-Go functional gauges on the shop floor. This reduces inspection time from 20 minutes on a CMM to 5 seconds by an operator, drastically cutting quality assurance overhead while guaranteeing the parts will assemble.
Design Changes and Cost Tradeoffs
Before paying for tighter tolerances, evaluate these design-for-manufacturability (DFM) adjustments to absorb variation:
- Shorten the dimension chain: Can a bracket mount directly to the frame instead of routing through the cover?
- Use slotted holes: A slotted secondary hole absorbs 1D variation (like bend location error) without binding. However, ensure your Bill of Materials (BOM) specifies a flat washer large enough to span the slot, preventing the fastener head from pulling through the sheet metal. Note that slots cannot replace primary locating features; the design still requires a precise primary datum hole.
- Incorporate floating hardware: Floating nut plates or oversized clearance holes allow fasteners to shift and align during assembly.
- Post-bend machining: If a hole pattern on a bent flange requires extreme precision, machine the holes after bending. This is highly accurate but adds a secondary CNC setup, increasing the unit cost.
Table 3: DFM Modification Cost vs. Impact
Table 3: DFM Modification Cost vs. Impact
| Design Change | Stack Reduction | Cost Effect | Inspection Effect |
|---|---|---|---|
| Common datum | High | Low | Easier |
| Slotted secondary hole | Medium | Low | Minimal |
| Floating fastener | Medium | Medium | Minimal |
| Post-bend machining | High | High | Additional setup |
| Tighter bend tolerance | Medium | Medium to high | More inspection |
Validate the Stack Before Production Release
Theoretical tolerance calculations mean nothing if they are not validated on the shop floor. Transitioning from engineering design to mass manufacturing requires testing the stack against physical prototypes and actual process data.
Prototype and DFM Review
Complete a dimension chain review before releasing the design to production. Physical prototypes reveal what software calculations often miss, such as operators using “forced assembly” to make things fit.
Operators might physically pry or bend parts to align holes. While this gets the product out the door, it introduces invisible residual stresses that lead to premature fatigue failures, cracked welds, or loosened fasteners in the field.
During the prototyping phase, measure the actual gaps and position offsets, then compare them against your Worst-Case or RSS calculations. If the physical results deviate heavily from the math, the measurement datums, assembly sequence, or assumed process capabilities are likely flawed.
A high-value Design for Manufacturability (DFM) review should not simply reject a tight tolerance; it must provide actionable, specific solutions. A proper DFM report should pinpoint:
- Which primary datum should be moved to a functional mating face.
- Which non-critical dimensions can be safely widened to save costs.
- Which dominant contributor requires a tighter tolerance.
- Where a round clearance hole should be converted into a slotted hole.
- Which extreme-precision feature must be machined after the bending operations.
Capability and Measurement
Do not confuse a CNC machine’s advertised precision with the actual process capability of a completed part. A laser cutter might advertise ±0.02 mm positioning accuracy, but thermal warping and material stress release on a 2.0 mm aluminum sheet can easily result in an actual process capability of ±0.15 mm. Always base calculations on measured historical data, not machine brochures.
To accurately predict tolerance stacking in volume production, collect data from First Article Inspection (FAI) or pilot runs to calculate the actual mean and standard deviation.
Evaluate the process using Cp and Cpk capability indices. If a manufacturing process has a Cₚₖ below 1.33, statistical tolerance analysis (RSS) is invalid because the process is not stable enough to guarantee the assumed normal distribution. Look for mean shifts between batches or tool changes.
Align the inspection setup with the design intent. Using the wrong measurement tool invalidates the stack. Apply tools based on their strengths:
- Calipers and Micrometers: Suitable for simple linear dimensions and thicknesses.
- CMM (Coordinate Measuring Machine): Required for true position, complex GD&T datum reference frames, and multi-axis variations.
- Functional Gauges (Go/No-Go): The most cost-effective method for verifying actual interchangeability and Mechanical Fit on the assembly line.
- Gauge R&R: Conduct Gauge Repeatability and Reproducibility studies to ensure your measurement system isn’t consuming the tolerance budget.
Supplier Control Plan
To prevent tolerance stack-up failures in mass production, engineering and procurement must establish a strict control plan with the manufacturer. Throwing a drawing over the wall is a recipe for scrap.
Provide your manufacturing partner with:
- Clear 2D drawings and exact 3D CAD models.
- Clearly identified Critical-to-Quality (CTQ) features and functional datums.
- Exact material grades and surface finish thicknesses.
- Process capability targets (e.g., Cₚₖ ≥ 1.33 for CTQ dimensions).
- Required inspection frequencies and sampling sizes.
- Strict ECO (Engineering Change Order) management: Ensure the supplier’s shop floor is actually using the latest revision. Outdated flat-pattern files remaining on a laser cutter’s hard drive are a leading cause of sheet metal stack-up failures.
In return, demand that the supplier feeds back:
- Their actual, historical process capabilities for similar features.
- Suggested tolerance adjustments based on their specific equipment.
- The inspection methods and holding fixtures they plan to use.
- FAI measurement data verifying the initial stack-up assumptions.
Conclusion
Tolerance stacking should begin with the final assembly requirement and end with hard production data. Tightening every part tolerance on a drawing is an expensive substitute for good engineering. Before demanding extreme precision, reduce the number of contributing parts in the stack, improve the datum strategy, and heavily control only the dimensions that have the greatest physical impact on the final fit.
Ready to eliminate assembly risks?
Upload your 2D drawings and 3D files for a comprehensive DFM and tolerance review. At Shengen, our engineering team evaluates your critical stack-ups across rapid prototyping, CNC machining, and sheet metal fabrication.
Hey, I'm Kevin Lee

For the past 10 years, I’ve been immersed in various forms of sheet metal fabrication, sharing cool insights here from my experiences across diverse workshops.
Get in touch
Kevin Lee
I have over ten years of professional experience in sheet metal fabrication, specializing in laser cutting, bending, welding, and surface treatment techniques. As the Technical Director at Shengen, I am committed to solving complex manufacturing challenges and driving innovation and quality in each project.